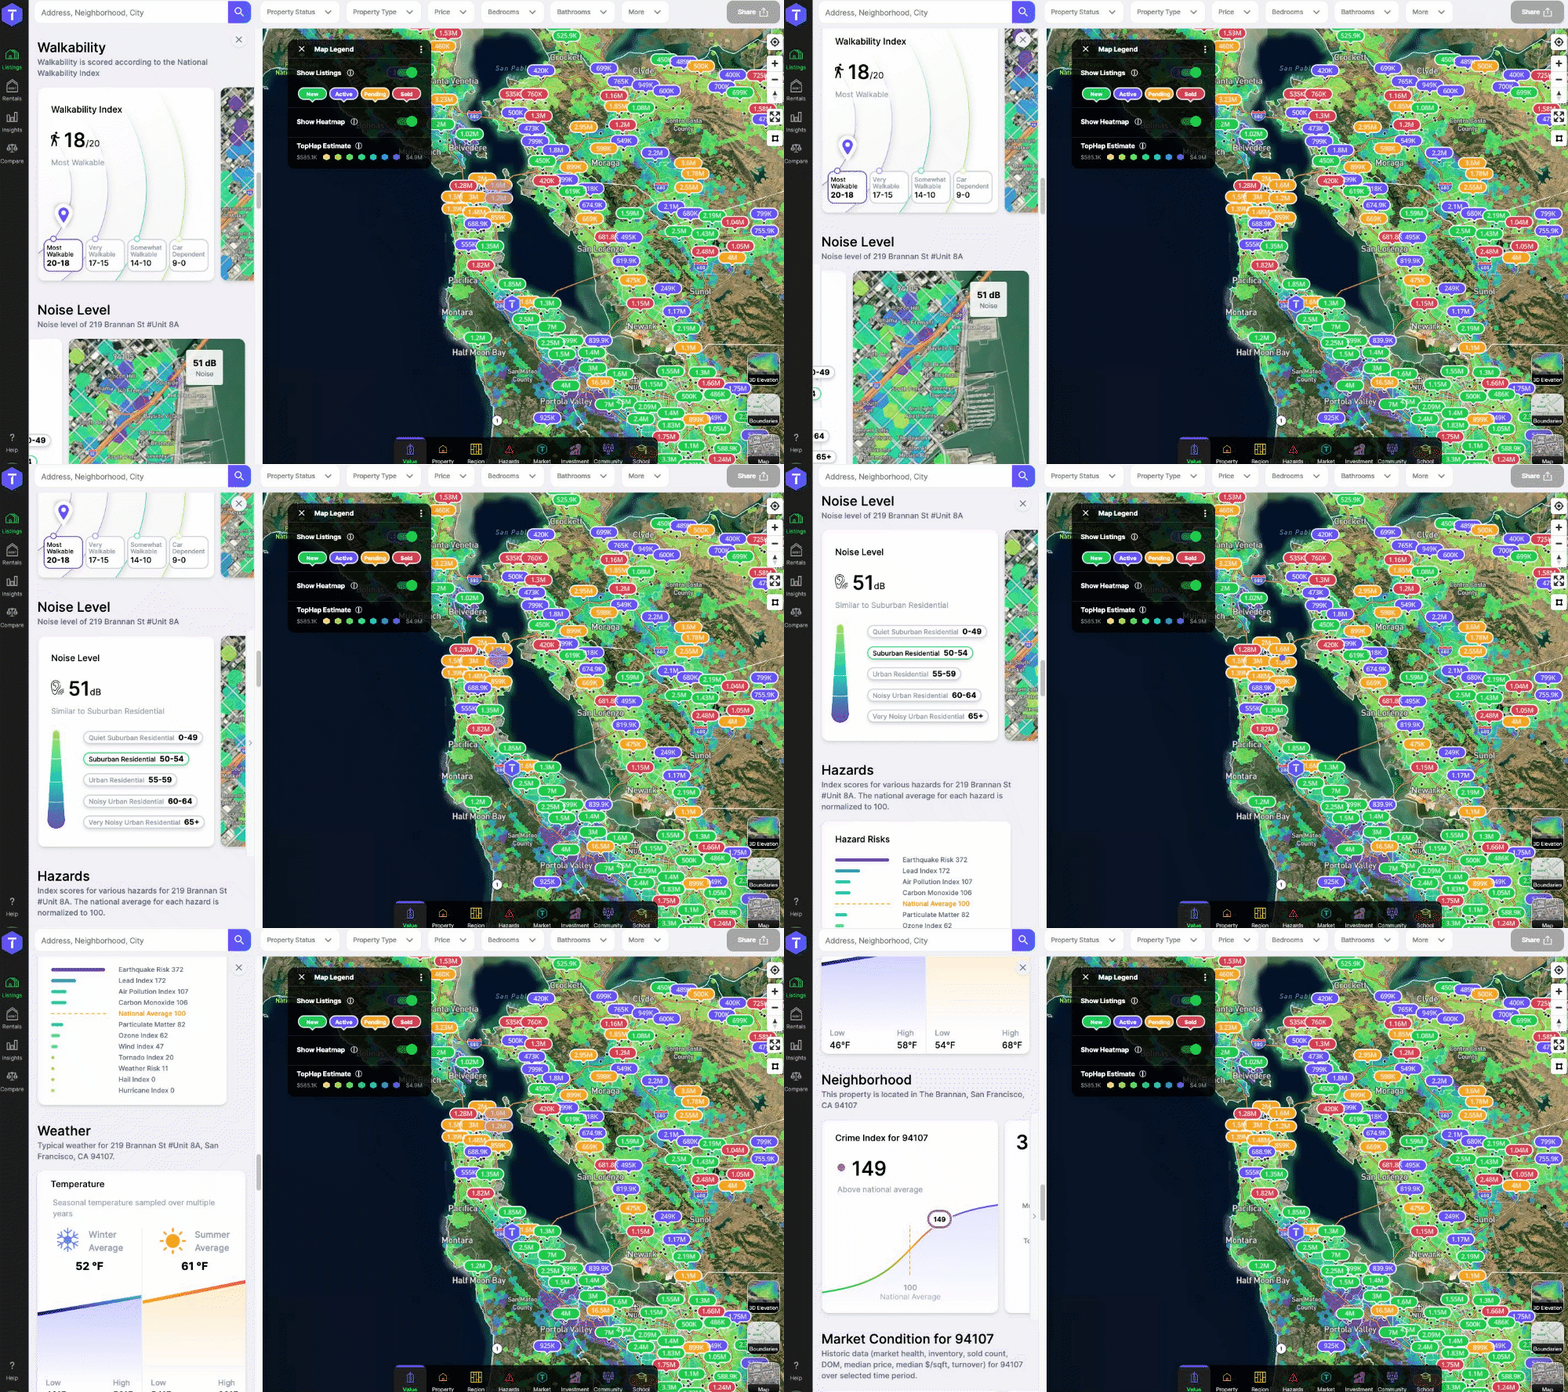
We recently added 7 new widgets to our property detail page, which will help you better understand your target property’s construction history, ownership information, and market conditions.

Market Condition Gauge
In this release, we updated the market condition section to include many new widgets including this gauge, which displays the months of inventory in the target property’s zip code. From this chart you can see if the house is in a Buyer, Seller, or Balanced Market.

Absorption Rate
The absorption rate widget is inside the Market Condition section next to the market condition gauge. It shows the percentage of listed homes that were sold each month for the target property’s zip code and is useful for determining how active buyers are in this area.

Neighborhood Turnover Rate
Inside the neighborhood section, we now have a turnover widget, which shows what percentage of total homes in the neighborhood are sold each year.

Permits Section
This section shows the entire permit history of the property including, # of permits, total permit amount, and permit details. Use it to find all of the permitted work that was done to the property and which companies completed it.

Current Ownership Section
In this release, we also introduced a new section that highlights information about the current owner(s) of the property. This section is currently only available for users on the expert plan and is helpful for identifying potential sellers or estimating monthly property taxes.

Weather
The new weather widget shows seasonal low, high, and average temperatures for the target property, and can help you rule out properties or areas that don’t match your lifestyle preferences.

See all these new widgets and more on TopHap!